How to Read Financial Statements for Stock Analysis
If you want to become a better investor, you need to know how to read financial statements for stock analysis.
This is one of the most practical skills in investing. It helps you move beyond opinions and into evidence. Instead of guessing whether a company is healthy, profitable, or risky, you can look directly at the numbers and judge for yourself.
The three financial statements every investor must understand are the balance sheet, the income statement, and the cash flow statement. Together, they tell the story of a business.
Why Financial Statements Matter
A stock price can tell you what the market feels today. Financial statements tell you what the business is actually doing.
They show:
- whether revenue is growing
- whether profits are real
- whether debt is manageable
- whether the company generates cash
- whether management is improving the business over time
Long-term investing gets much easier when you know how to connect those dots.
The Income Statement: Is the Business Profitable?
The income statement shows revenue, expenses, and profit over a specific period. (Every Income Statement Tells a Story)
Think of it as the operating scoreboard.
What to look for:
Revenue growth: Is the company growing sales consistently over time?
Gross profit: After direct costs, how much money is left?
Operating income: How profitable is the core business after operating expenses?
Net income: What is left after everything?
EPS: How much profit is the company generating per share?
A strong business usually shows consistent revenue growth, improving operating leverage, and a trend of rising earnings over time.
Be careful with companies that grow revenue but never seem to translate that growth into bottom-line performance. Growth without profits can work for a while, but eventually the economics have to prove out.
The Balance Sheet: Is the Business Financially Strong?
The balance sheet is a snapshot of what the company owns, what it owes, and what belongs to shareholders.
This statement matters more than many investors realize.
Key areas to study:
Cash and investments: Does the company have liquidity?
Debt: How much leverage is on the business?
Current assets vs. current liabilities: Can the company handle short-term obligations?
Shareholders’ equity: Is the business building value over time?
A strong balance sheet gives a company options. It can invest through downturns, handle unexpected shocks, and avoid raising expensive capital at the worst possible time.
A weak balance sheet can ruin an otherwise good business. Too much debt reduces flexibility, increases risk, and can force management into defensive decisions.
The Cash Flow Statement: Is the Profit Real?
This is where many investors find the truth. (Capital Allocation in Investing)
The cash flow statement shows how cash moves through the business. It is divided into:
- operating activities
- investing activities
- financing activities
Why this matters:
A company can report accounting profits while struggling to generate real cash. That is why cash flow analysis is so important.
Focus especially on:
Cash from operations: Is the business generating cash from its core operations?
Capital expenditures: How much must be reinvested just to maintain the business?
Free cash flow: What is left after required spending?
Free cash flow is one of the most important numbers in investing because it gives management real choices. It can be used to reinvest, reduce debt, repurchase shares, pay dividends, or make acquisitions.
How the Three Statements Work Together
The biggest mistake investors make is reading one statement in isolation.
Financial statements should be read together.
For example:
- Revenue may be growing on the income statement
- But receivables may be ballooning on the balance sheet
- And cash from operations may be weak on the cash flow statement
That combination could signal lower-quality growth.
Or:
- Revenue growth may be modest
- Margins may be strong
- Debt may be low
- Free cash flow may be rising
That could describe a very high-quality business even if it is not the most exciting stock in the market.
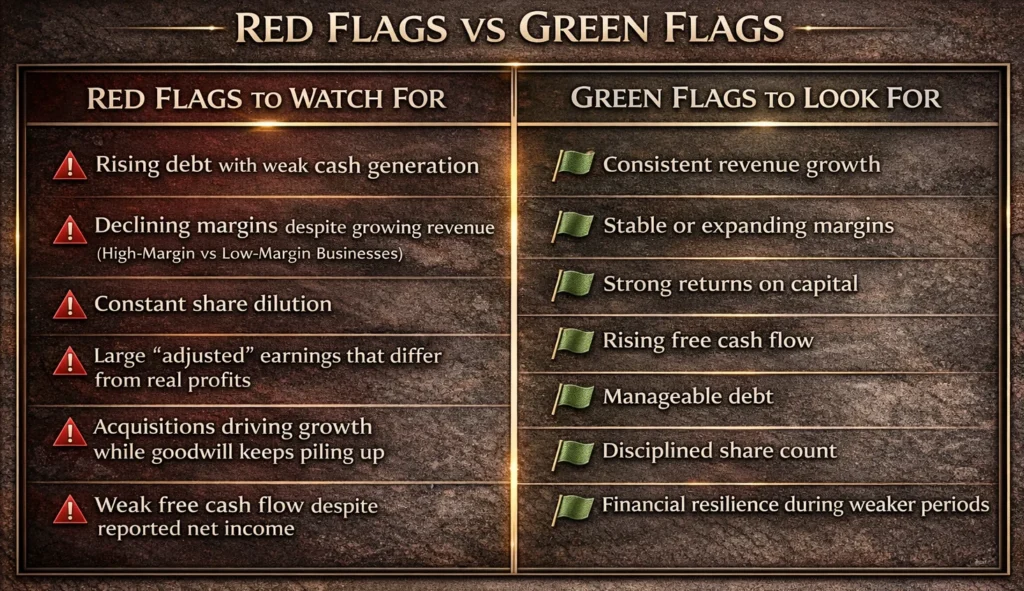
Red Flags to Watch For
When learning how to read financial statements for stock analysis, pay close attention to warning signs:
- rising debt with weak cash generation
- declining margins despite growing revenue (High-Margin vs Low-Margin Businesses)
- constant share dilution
- large “adjusted” earnings that differ from real profits
- acquisitions driving growth while goodwill keeps piling up
- weak free cash flow despite reported net income
One red flag alone is not always enough to kill the thesis. But several red flags together usually mean slow down and dig deeper.
Green Flags to Look For
High-quality businesses often show:
- consistent revenue growth
- stable or expanding margins
- strong returns on capital
- rising free cash flow
- manageable debt
- disciplined share count
- financial resilience during weaker periods
Those are the kinds of businesses long-term investors want to understand well.
Final Thoughts
Learning how to read financial statements for stock analysis gives you a huge advantage.
It helps you filter hype from substance. It helps you spot weakness earlier. It helps you understand which companies are truly compounding and which are just selling a story.
The income statement shows performance.
The balance sheet shows strength.
The cash flow statement shows reality.
When you can read all three together, you stop investing based on noise and start investing based on evidence.